The 2023 edition of the World Nuclear Industry Status Report (WNISR 2023) once again provides a comprehensive review of industry growth, performance, and political and economic drivers around the world. This has always been a huge undertaking, but is made ever more so by a continuing migration away from critical analysis of nuclear power by many of the traditional funders supporting analysis of nuclear policy. My personal view is that careful evaluation of the economic, political, and environmental aspects of all energy pathways remains critical in helping us make good choices and avoid big problems. The importance of these reviews grows as niche ideas start to scale since sometimes side-effects that can be ignored during early research and pilot phases become big problems once the production base is big. This is a large issue with biofuels, where growing scale increases conversion of natural habitats and the diversion of staple crops from food and feed sectors into energy. For nuclear, there are trade-offs on cost and timing of delivery in addition to the proliferation concerns that remain.
I was happy to be able to contribute to the WNISR 2023 effort, writing the Economics and Finance section of the paper. Key findings and extracts from that section are presented below.
Economics and Finance Chapter WNISR 2023 Full Report
WNISR 2023 Global Launch Slide Pack
Nuclear's continuing economic challenges
The engineering allure of nuclear is understandable given it is a compact, high load-factor and low-carbon power source. These attributes are desirable in a world with growing demand for energy and increasingly dire concerns about greenhouse gas emissions. Public pronouncements touting these benefits are common (this one says nuclear is the "only" solution to climate change). At the recently concluded COP28 meetings, nuclear was specifically included for the first time since the meetings started in 1995, with a global commitment to triple capacity. The International Atomic Energy Agency noted that
the inclusion of nuclear, together with a separate declaration made last week at COP28 by more than 22 countries to advance the aspirational goal of tripling nuclear power capacity by 2050, as well as statements by the IAEA and the nuclear industry, underscored the momentum building behind the world’s second largest source of clean electricity.
But the economic challenges that have plagued nuclear's growth for more than a half-century remain. The sector continues to struggle with rising costs, which, combined with long construction delays, has made investors wary. While routinely including cost reductions from learning (the "Nth of a kind reactor, or NOAK) in cost projections and modeling of decarbonization scenarios, these gains remain largely speculative rather than empirical. The sector has had much lower learning curves than its competitors in recent years. Between 2010 and 2021, the global-weighted levelized cost of energy (LCOE) for utility scale PV dropped by nearly 90 percent, by nearly 70 percent for concentrating solar power and onshore wind, and by 60 percent for off-shore wind. Lazard’s U.S.-focused analysis of LCOE shows significant declines since 2009 (83 percent for utility scale solar and 63 percent for onshore wind) as well, despite an uptick in costs during 2022–2023. In contrast, the LCOE for nuclear has risen 47 percent over the same period. Even in the elevated growth scenarios for nuclear that are now being discussed, the unit counts remain orders of magnitude lower than competitors, providing a much smaller base for learning, materials substitution and evolution, production scale, and workforce development.
The result has been a push for ever increasing "policy support" -- simply a polite way to say "massive government subsidies."
Further, innovation within the power sector and increased ability for loads to time shift their demand has already put even operating reactors (where much of the capital cost has already been paid off) under competitive pressure. These pressures are likely to increase going forward. The result has been a push for ever increasing "policy support" -- simply a polite way to say "massive government subsidies." Though the form is not identical across countries, subsidies have been provided in virtually all countries and stages of the fuel chain.
Operating reactors rely on regulated rates or state subsidy to stay in business
For decades, proponents have characterized nuclear power as “expensive to build but relatively cheap to run”. The characteristics driving this claim are low operating costs in comparison to other power sources, a long operating life for reactors, and high load factors that enable the investment costs of nuclear power plants to be spread over many kWh, thereby reducing the fixed costs per unit of energy produced.
But a combination of rising competition and, particularly in France and Japan, rising maintenance costs and outages, have put operating reactors under pressure. In the US, inexpensive natural gas from fracking has been a big factor. There is also pressure from paired solar and storage, where declining costs and higher load factors from the battery firming has been increasingly competitive.
Market transitions are a standard part of economic growth and resiliency: innumerable facilities shut down temporarily or permanently when changing market conditions render their products too expensive or no longer desired by consumers. Permanent shutdowns happen routinely, and rarely is this because the facility is no longer physically able to produce its product. Indeed, those closures are not viewed as “premature” but rather as the normal functioning of market forces, retiring obsolete assets to make way for competitive new ones.
Nuclear plant closures have been framed entirely differently. Arguing that plant closures would drive up carbon emissions and that their product, labelled “low-carbon, reliable power”, was not being properly valued by the market, the industry has tagged the closures as premature, and has lobbied for—and increasingly often successfully obtained—subsidies to remain in operation. Within the United States, operating subsidies at the state level are estimated to exceed $15 billion by 2030, with new and large supports at the federal level as well. In France, poor economics led to the renationalization of EDF in a transaction finalized in June 2023. French taxpayers will now be enlisted to support reactor refurbishment and operation, as well as the construction of new facilities. In Belgium, subsidies are being directed to restart two reactors and the state has capped the nuclear waste liabilities of utility Engie. And in Japan, a large number of reactors remain closed since the Fukushima accident in March 2011 and the government plans to provide subsidies to accelerate reopenings.
These and similar policies around the world have slowed the pace of reactor exits on the grounds that the reactors provide a short-term bridge of low carbon power and should be protected. Note that a similar outcome -- likely including life extensions for many existing reactors -- would have been achieved by countries pricing greenhouse gas emissions. However, unlike the earmarked subsidies for nuclear, carbon pricing would have put the cost of emissions on polluters and allowed any sector able to provide low-carbon economic services (including, but not limited to electricity) to compete on an equal playing field.
While operating subsidies will keep units open longer, the mean age of reactor fleets outside of China continues to climb: 42.1 years in the US, 37.6 years in France; 29.4 years in Russia. China's mean reactor age is 9.3. (WNISR 2023: 68). Even with subsidies and license extensions, these older units will continue to close over time, and for nuclear to make a material contribution to global decarbonization, there will need to be a large and sustained set of new reactors coming online.
Nuclear newbuild has become less competitive over time; SMRs seem unlikely to solve this
Estimates of the cost of newbuild reactors are often presented as Overnight Capital Costs (OCC), where the costs of financing, delay, operations and grid connections are ignored; or as a Levelized Cost of Energy (LCOE) which incorporates many of the factors missing from OCC metrics. The OCC is simpler to do, though because construction delays and finance costs are central to the delivered cost of nuclear, it is not a very robust metric for the sector. In the WNISR we reviewed existing OCC and LCOE estimates from a range of studies. Even with the OCC, estimates varied by more than a factor of three across countries. OCC costs per kW for SMRs were also significantly above those for LWRs, highlighting one of the central challenges SMRs face in gaining market share even if NOAK gains are realized. Data availability and cost of capital assumptions varied across assessments.
The graph below was developed by the IEA in 2020 to show the sensitivity of LCOE estimates to different assumptions on the cost of capital. The lines indicate median values; the shaded area is the 50% central region (20% central region for renewables). The vertical bars on the left chart have been added to show more recent estimates both by IEA and within Lazard's annual review of LCOE trends.
At very low discount rates, nuclear is highly competitive. This visually illustrates why so many nuclear subsidies focus on shifting the cost and risks of finance from developers onto the state, taxpayers, or customers. However, “shifting the risk does not magically reduce the financing cost; the government’s cost-of-capital is not necessarily less than [that of] private investors.” Instead, it often means that the government entity is providing a larger credit subsidy to the riskier beneficiary, not that risks are somehow more effectively managed. Nuclear begins to be out-competed by gas at discount rates of around 5 percent/year. At the upper range of a 20 percent/year real cost of capital, nuclear is by far the most expensive, and its median LCOE has jumped five-fold relative to the resource’s lower bound cost. While 20 percent real may seem an excessively high discount rate, target hurdle rates for high-risk venture capital and private equity (a source of capital for some of the new SMR funding) are often around this level.
A few other points are worth noting. First, IEA's estimates assume NOAK gains for nuclear and some price ($30/t) on carbon for coal and gas. Both benefit nuclear's competitive position. Second, the more recent estimates of nuclear LCOEs have been moving up sharply relative to 2020 and earlier. Using these newer estimates, nuclear is not competitive even within the central case discount rates of 7-9%. Third, the Lazard estimate for the US is markedly higher than estimates coming out of the IEA. While Lazard's estimate is based on a smaller sample set (the Vogtle reactors in the US), it also reflects actual rather than projected costs. A meta analysis of 88 reactor projects across the world found actual costs to be much higher than the projected ones, and construction times much longer.
While most scenarios show nuclear as more expensive than renewables (and the LCOE does a much better job then the OCC in capturing the economic implications of both delayed openings on nuclear and lower load factors on renewables), comparisons with renewables plus firming provide better metrics. Nuclear is starting to be out-competed there as well. Finally, a market-based view of project risk would likely ascribe a higher, and possibly significantly higher, discount rate for nuclear than for the other energy pathways shown. This would worsen the competitive position of nuclear relative to all of its competitors. Despite much effort, we were not able to identify any market-based estimate for the cost of capital of newbuild nuclear. Every project had significant government intervention.
Lower nuclear LCOEs in China, Russia, South Korea, and a few other countries have been of great interest, and can be seen for China and India in the chart below. Lower cost labor in China and South Korea has been flagged as one source of advantage, as has been better construction management approaches in a number of the lower-cost countries. However, limited data availability has prevented full estimates of LCOEs in many countries by disinterested parties. This is an area of focus that I hope can part of the next WNISR. But given the uncertainties, and full state ownership of the entire fuel cycle in China and Russia, direct comparisons should be done with caution. Subsidies within state-owned enterprises are often both large and quite hard to see and quantify.
Within the low-cost countries, it is also important not to evaluate these competitive advantages in isolation. Whatever its cause (including large state subsidies), the cost advantage also applies at least equally to other forms of energy as well. For example, Chinese wind and solar were well below the cost of Chinese nuclear on a levelized cost/MWh basis, “so China invested at least as much in renewables in 2020 as it had invested cumulatively in nuclear power during 2008–20, adding half the world’s 2020 new renewable capacity and 80% of the global increase over 2019’s.” .
Figure 1
Sources: NEA/IEA 2020; IEA 2021-23; Lazard 2023
Government subsidies to nuclear have always been large, but they are getting bigger still
Functioning markets allow complicated trade-offs to be made more seamlessly. In cases where there are externalities such as carbon emissions, putting a price on them can address the problem over time. That approach also allows the full range of possible solutions to come to the fore: new generation, efficiency, load shifting, power storage, and so forth. With subsidies, political lobbying or governmental preferences become much more important determinants of where limited public resources are spent, for how long, and which solutions "win."
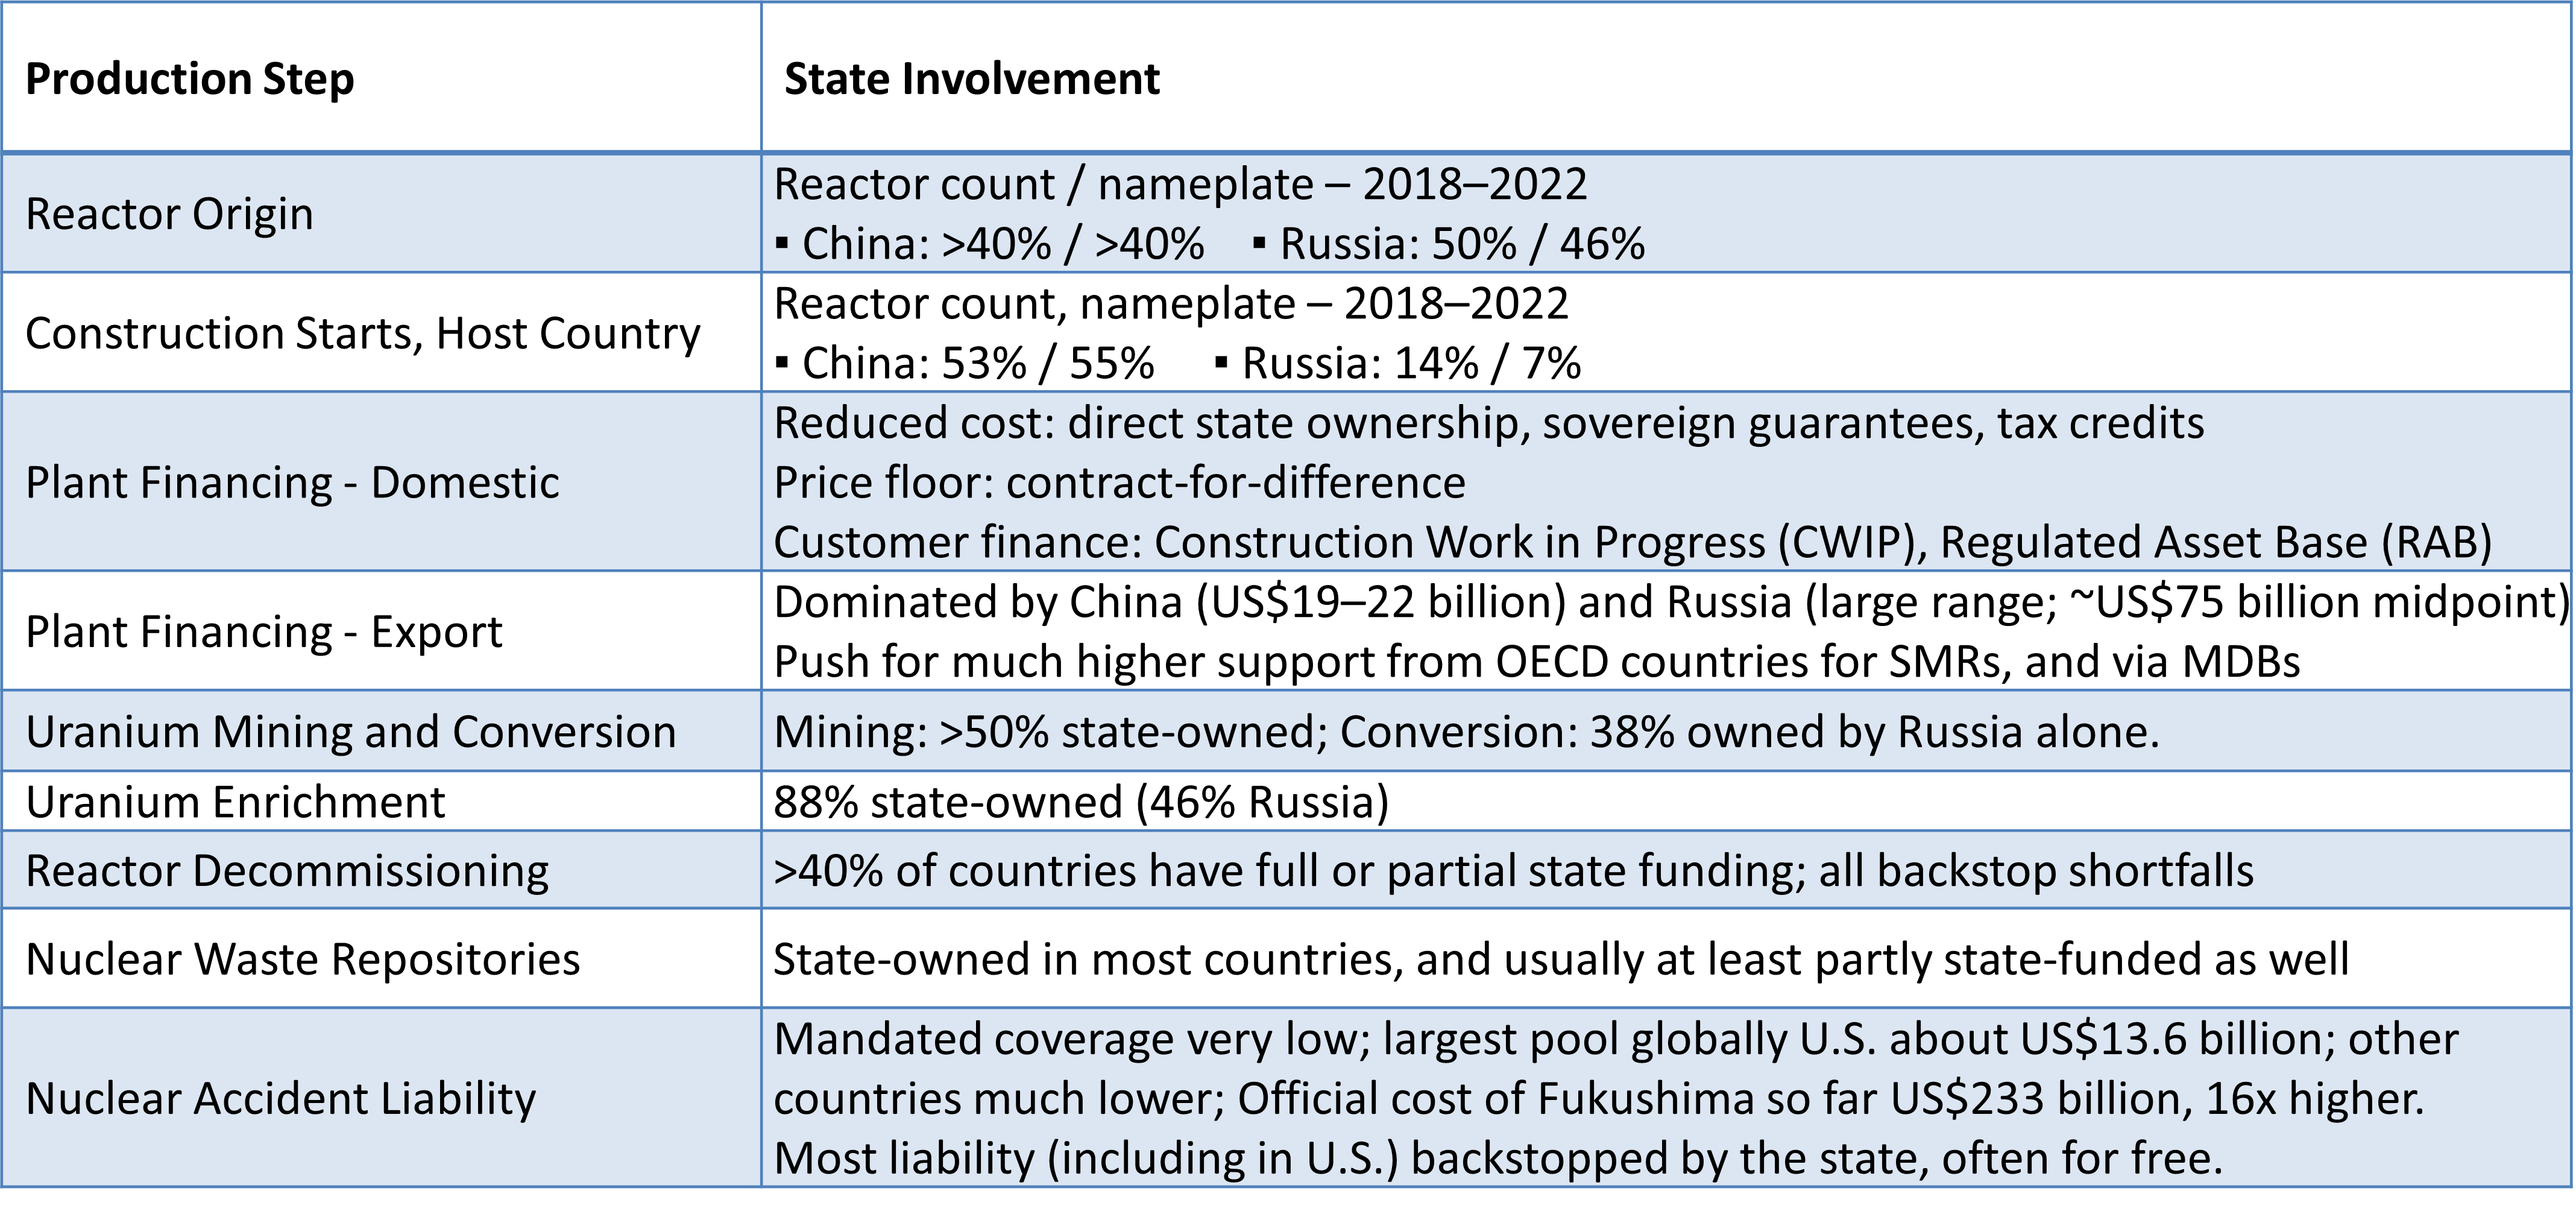
Table 1 provides an overall picture of the role of the state in the nuclear energy pathway. Each element is discussed in much more detail in the Economics and Finance chapter. But it is evident even within the Table how significant a role state ownership and support plays in the rise of China and Russia within the nuclear sector; and in key steps of the fuel chain, including uranium mining, conversion, enrichment, facility decommissioning, nuclear waste management, and accident liability. Also important is just how many different ways governments have tried to subsidize the cost to finance new plants. Because there are many ways to decarbonize the world, directing so much support by government fiat creates competitive problems that likely result in decarbonization that is smaller in scale, slower, and more expensive that what could be achieved by pricing carbon.
Table 1
Large and Growing Role of the State in all Parts of the Nuclear Fuel Chain
Source: Compiled from WNISR 2023
New markets for nuclear will be challenging and often compete with existing electricity customers
Frequently-mentioned areas of future growth for nuclear include production of hydrogen, water desalination, high temperature heat, and power for industrial production, and dedicated use for remote locations or high-demand applications such as data centers. These applications require cost-competitive power. Unless newbuild nuclear can achieve large cost reductions, new reactors are not likely to drive growth in these other areas.
Rather, the most likely way to support these new markets will be from the existing set of operating reactors. Efforts to use surplus power from existing nuclear to support these markets is attractive since the cost of power from existing reactors is lower, and there is excess supply during some periods of the day. However, because the industrial users require highly reliable deliveries to keep production orderly, efficient, and competitive, either a dedicated reactor or a 24/7 slice of reactor production would be needed. This would put these other uses in competition with current grid users for low-carbon electricity rather than increasing the overall supply. Particularly where market diversions are driven by government subsidy (perhaps the case with hydrogen in the U.S.) rather than economic value, both system costs and carbon emissions could rise.
Table 2
Source: Compiled from WNISR 2023


